If you are using a mobile device to view and analyze your data, you can interact with visuals using "touch" gestures. These gestures allow you to explore data, access context menus, and perform actions without a mouse or keyboard.
Interacting with discoveries
You can engage with various visual components, including:
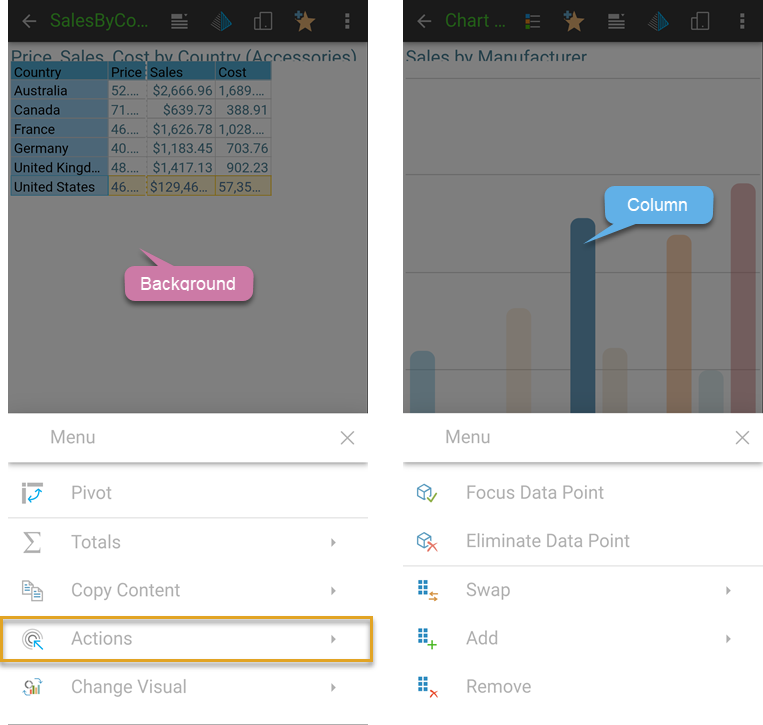
- Data points: Long tap the grid cell or chart segment that represents the data point to open the Interaction menu.
- Measures and Member headers: Long tap the relevant measure or member header to open the Interaction menu.
- Chart backgrounds and Grid backgrounds: Long tap the chart background, grid background, or an empty cell to open the Interaction menu.
In each case, a long tap on the selected item opens an Interactions menu. This menu includes the relevant interaction options for you to choose from. Where the menu option includes an arrow, clicking opens a submenu; for example, the Actions menu (orange highlight below) opens a list of those actions that have been configured for the report.
Tip: If you don’t see the menu option you are interested in at first glance, try dragging the options that you can see up or down to scroll through the list.
Interaction Menu
- Actions: On mobile devices, you can run actions on your discoveries or presentations either using a long tap to open the Actions menu or using a standard tap where the Run From configuration enables Mouse Click. You can also tap images, infographics, and so on that have an associated jump action.
- Add, Remove, and Swap: Inject, remove, and replace hierarchies respectively. (These options are variations of Dice.)
- Change Visual: Change the visualization type used for the data / underlying query. For example, use this option to change your grid of data into a line chart instead.
- Copy and Copy Content: Copy the raw data or visual data, or a given row, column, or data point.
- Dice: Dicing allows you to 'drill across' from a chosen element into another hierarchy.
- Focus and Eliminate Data Point: Focus or eliminate a selected data point or member.
- Hide or Show Range Slider: Use the range slider to explore Cartesian charts that contain a large amount of data.
- Interact: Presentations only. Cross-filter discoveries.
- Member Selection: Select elements to focus on or eliminate.
- Pivot: Switch the discovery's x- and y-axes.
- Quick Filter: Filter the data and items in queries.
- Quick Sort: Sort the data and items in your visual by descending, ascending, or custom values.
- Total function: Add "totaling" to grids to add context and information to the report.
Tip: If your discovery is not responding as expected, you should check that your device’s touch screen is clean and functioning properly.